DRISHTI · CHAPTER 3.1
Strangers Agreed on a Metre, Then Typed Up the Rain
Before a number could travel, strangers had to agree what it meant. Then the old numbers had to be typed in, by sixteen thousand volunteers, during a lockdown.
EARTHVISION LAB · ~10 MIN READ
NUMBERS THAT TRAVEL
The Kyoto cherry diaries, which Volume 2 met as a thermometer with roots, were written as literature: which garden, which poem, which party, who drank rather too much under which tree. As data they keep exactly one thing, a date.
That is a terrible summary of a party and a superb climate record, because it lets someone who has never read a line of Japanese poetry set 1409 beside 2021 and notice that spring has moved.
That is the bargain behind every number in this volume. A farmer's knowledge died with the farmer. A number written down in 1850 can still be argued with in 2050. Numbers only travel, though, if the people at both ends agree what they mean, and agreement turned out to be much harder to manufacture than thermometers.
Three agreements did most of the work: how long a unit is, where exactly to hold the instrument, and what time it is. Each was negotiated by people who had other things on their minds, including a revolution, and each quietly decided what the resulting numbers would never mention.
UNITS
The metre was slightly wrong, and everyone agreed to it
Before the Revolution, France used several hundred units of length and weight, many of them changing from one town to the next, which made buying cloth a minor branch of mathematics. In 1791 the National Assembly replaced them with a unit belonging to no king and no town: the metre, one ten-millionth of the distance from the North Pole to the equator. It was a unit taken from the planet itself, a lovely idea with one practical drawback, which was that somebody now had to go and measure the planet.
In June 1792 Jean-Baptiste Delambre set off north towards Dunkirk and Pierre Méchain south towards Barcelona, surveying the meridian through Paris from church towers and hilltops across a country in the middle of a revolution. Men climbing steeples with strange instruments in wartime were arrested as spies with some regularity. They were stranded by war and delayed by the Terror, and the job took seven years.
Méchain found a small inconsistency in his measurements at Barcelona and could not make it go away. He hid it, smoothed his figures and spent the rest of his life tormented by the secret. The metre fixed in 1799 came out about 0.2 millimetres shorter than its own definition, mostly because Earth is not quite the shape the calculation assumed. Nobody corrected it. By the time anyone could, the platinum bar mattered more than the planet it was supposed to describe, because everybody was already using it. A standard earns its value by being shared. Being correct is a pleasant extra.
SCALE, EXPOSURE AND TIMING
A lawn in a box, and the same moment everywhere
Volume 2 credited Fahrenheit with thermometers that agreed with each other. The scale took longer. In 1742 the Swedish astronomer Anders Celsius fixed his to water, with 0 at boiling and 100 at freezing, so that on his original scale a hot day was a small number and a cold one a large number. It was turned the right way up soon after he died in 1744, which is why a warm afternoon is not described as 75 degrees of cold. The real gain was the anchor: anyone with a kettle and some ice could check a thermometer against the same two points.
Then came the question of where to hold it. A thermometer in the sun measures the sun, and one on a wall measures the wall. In 1864 the Scottish lighthouse engineer Thomas Stevenson, father of the author of Treasure Island, designed a white box with double-louvred sides that let air in and kept sun and rain out, standing 4 feet off the ground. Versions of it now stand at weather stations everywhere, and the World Meteorological Organization specifies air temperature taken between 1.25 and 2 metres up, over short grass, in shade and moving air.
The temperature on the evening news is therefore, strictly speaking, the temperature of a lawn in a box. This sounds like a confession and is actually an achievement. It is the reason a reading from 1880 can be compared with one from last Tuesday, and a reading in Oslo with one in Nairobi.
Time needed the same treatment. Each city once kept its own local time, so 8 o'clock in Paris and 8 o'clock in Vienna were nearly an hour apart, and a weather map drawn from their readings could show one storm as two, both of them wrong. In September 1873 the heads of Europe's weather services met in Vienna for the first International Meteorological Congress, which the World Meteorological Organization now counts as its founding. They agreed on units, methods, hours for observing and the free exchange of readings across borders.
The radiosondes of Volume 2, released from about 800 stations at the same instant twice a day, are that agreement still running a century and a half later. It may be the most successful piece of international diplomacy that nobody has heard of, largely because it worked.
Every standard buys comparison by leaving something out. Air at head height over grass in Oslo can be set beside air at head height over grass in Nairobi because the rock or peat under each lawn has been agreed out of the number. That is a good trade, and the only one that makes a global climate record possible. The trade also leaves no trace: a temperature series carries no footnote about lawns. Méchain's missing 0.2 millimetres never troubled anyone. Some of the other things standards leave out matter a great deal, and the first rule for using any old record is to remember that someone decided what it would not say.
SHIPS' LOGS
Records kept for other reasons, typed up by strangers
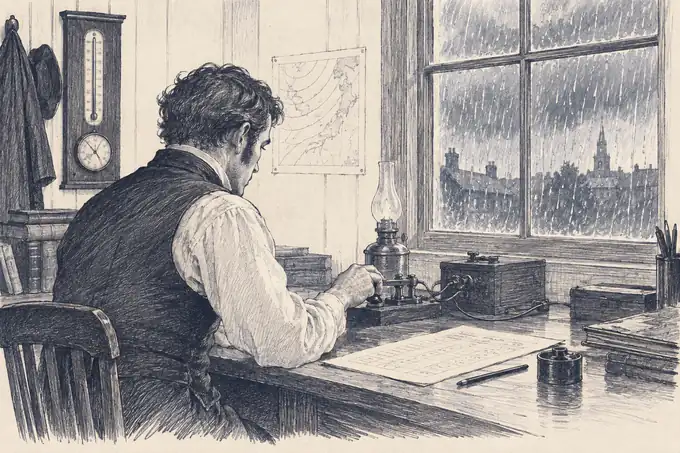
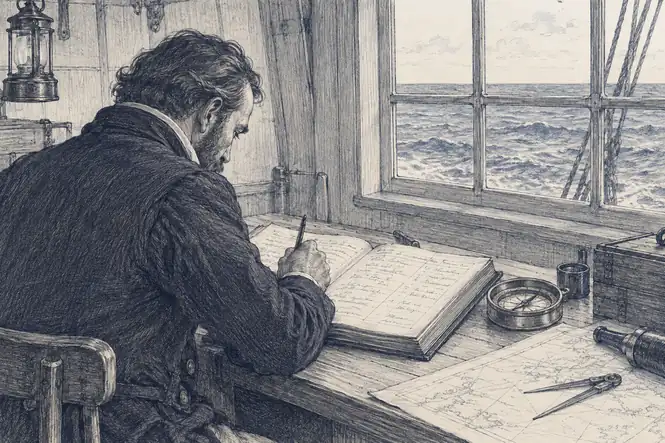
Somewhere in the nineteenth century, writing down the natural world stopped being tied to a particular question and became a habit. Ships logged the weather every few hours. Rain gauges were read every morning by clergymen, doctors and keen gardeners.
Museums filled drawers with specimens, each with a small handwritten label. Almost none of it was collected to answer the questions it now answers.
All of it was on paper. A ship's log in an archive is a perfectly good observation that no computer can read and no scientist can search. Finding the week a storm crossed the Atlantic in 1917 meant someone reading every page of every log from that year. Before those centuries of watching could become data, the numbers had to be typed in, and for a long time nobody could afford the typing.
Maury's standard ship logs, described in Volume 2, were a triumph of consistent recording and a disaster of accessibility. Across the nineteenth and early twentieth centuries, naval and merchant ships filled hundreds of thousands of logbooks with wind, pressure, temperature and position. They survived in national archives, legible, dated, positioned and entirely invisible to any computer.
In October 2010 a project called Old Weather, running on the Zooniverse citizen science platform, put scanned pages from Royal Navy logbooks of the First World War era online and asked the public to type in the weather. About 16,400 volunteers transcribed some 1.6 million observations from the logs of around 300 ships, a job that would have taken one person several lifetimes. Later phases moved on to U.S. ships in the Arctic, whose officers had noted sea ice in waters that now have far less of it.
The volunteers were doing more than copying. Each reading came with a date, a time and the ship's position, so a line of pencil from 1916 became a point in space and time that a climate reconstruction could use. The ocean of a century ago had been mostly blank in the global record. It began to fill in, one watch at a time, typed by people on their lunch breaks.
RAINFALL RESCUE
Five million numbers in sixteen days
The UK Met Office held 66,000 archive sheets of monthly rainfall totals from gauges across Britain and Ireland, some going back to 1677, the work of thousands of observers compiled by hand. They existed only as columns of handwritten figures, and typing them up had long been judged too large a job to contemplate.
On 26 March 2020, a few days into the first pandemic lockdown, the climate scientist Ed Hawkins launched Rainfall Rescue on Zooniverse. A country confined indoors turned out to be an outstanding transcription service. About 16,000 volunteers typed up all 5.28 million numbers in 16 days. Each figure was entered separately by at least four people and accepted only when three agreed, which is a sterner check than most paid data entry ever gets.
The rescued totals have since been checked and folded into the official UK rainfall record, pushing it back by decades and adding many places that had no digital history at all. Victorian droughts and floods can now be set directly beside modern ones. The gauges had been read every morning for three centuries. Making their readings countable took a fortnight of national boredom.
SPECIMENS AND STANDARDS
What, where, when, and who said so
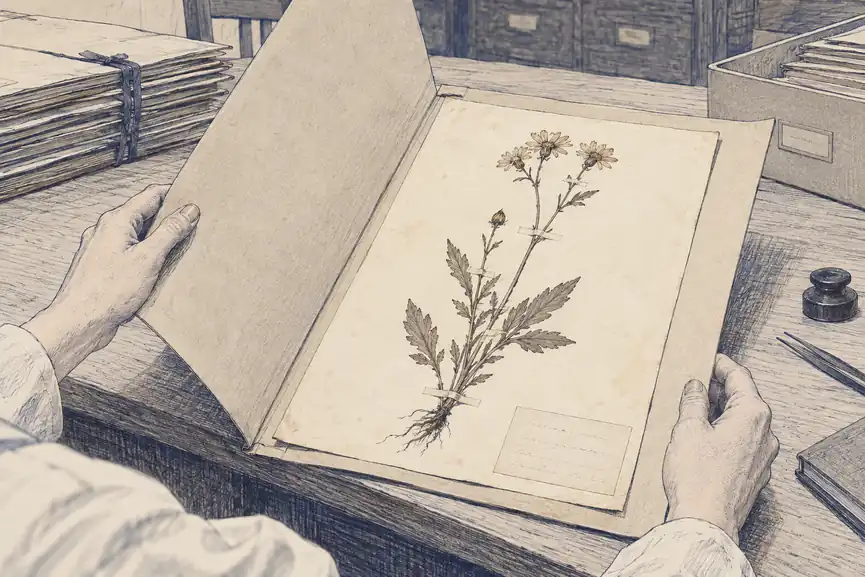
Natural history collections are the biological version of ship logs. A pressed plant or a pinned beetle was collected to describe a species, but its label also says where and when it was found, so a museum drawer is an accidental record of where species lived a century ago. Comparing those records with where the same species live now is one of the best ways of measuring how far life has moved as the climate warmed.
First the labels had to agree on what a record is. Biologists built Darwin Core, a standard list of fields for any observation of life: which organism, identified by whom, where, when, by what method, and kept by which institution. With it, a beetle in a London drawer, a bird logged on a phone and a camera-trap photograph from Kenya can be written in exactly the same shape. The Global Biodiversity Information Facility, an intergovernmental network, collects records in that shape from around the world, and by 2025 held more than 3 billion of them from about 2,300 publishing institutions, from herbarium sheets two centuries old to yesterday's birdwatching lists.
Typing a number in is only half the job. To use a rainfall total from 1850, a scientist needs to know which gauge took it, how high it stood, whether it was moved, and whether a blank means no rain or an observer on holiday. That information about the data, its metadata, is what separates a number from a measurement. The rescue projects kept it: Old Weather the ships' positions and times, Rainfall Rescue the station names and notes, Darwin Core the name of whoever identified the beetle. A record that can be questioned is the only kind worth using.
The past has become searchable. Centuries of patient watching by people who never imagined anyone adding their numbers up now sit in databases beside satellite records, lengthening every trend and filling places no instrument reached. A pile of well-described records is still a pile, though, until everything in it can be placed on the same map and the same clock.