DRISHTI · NOTE 002.4
Fifty Years of Pointing at the Same Places
A chemist on a volcano and three satellite programs discovered the same thing: the most powerful instrument is the one that never stops.
EARTHVISION LAB · ~6 MIN READ
RECORDS
On 29 March 1958, a young chemist named Charles David Keeling took his first reading of carbon dioxide in the air at a new observatory high on the slope of Mauna Loa, in Hawaii, chosen because the air there has crossed thousands of kilometres of ocean and arrives clean. The instrument read 313 parts per million. He kept measuring. After his death in 2005 his son Ralph took over, and the measurements have continued almost every day since.
Within a few years the record showed two things nobody had seen. The first was a yearly wave: carbon dioxide falls every northern summer as the forests of the northern hemisphere grow, and rises every winter as they rest, so the curve is, quite literally, the planet breathing. The second was that each year's wave sat higher than the last. By May 2025 the monthly average at Mauna Loa had reached 430.2 parts per million. No single measurement could have shown either finding. They exist only because one place was measured the same way, without stopping, for longer than most careers.
Fourteen years after Keeling's first reading, Landsat 1 reached orbit, and the same idea went global. Three satellite programs, in particular, turned repetition into a way of seeing the whole planet change.
1958
Keeling's first Mauna Loa reading
1972
Landsat 1 · every 16 days
1999
MODIS on Terra · twice daily with Aqua
2008
Every Landsat scene made free
2014
First Copernicus Sentinel
Each record became valuable by refusing to stop.
LANDSAT
Landsat made change visible
One photograph of a lake says nothing about which way the lake is going. Landsat's gift was not a sharper photograph, since Corona had taken those in secret. It was taking the same photograph of the same ground, in public, every 16 days, from 1972 until now, through nine satellites and more than fifty years. The record kept going through a failed privatisation in the 1980s, a satellite lost at launch in 1993 and a jammed mechanism on Landsat 7 in 2003, each time because enough people decided that stopping was not an option.
Then the price fell to nothing. In 1991 a Landsat scene cost $600, and about 53 left the archive each day, mostly to funded research projects. On 21 April 2008 the U.S. Geological Survey made every scene free, and daily downloads jumped to 5,775. The satellites had not changed. What changed was who could afford to ask a question that might not work out. A graduate student could now try an idea on a Tuesday afternoon that a decade earlier would have needed a grant.
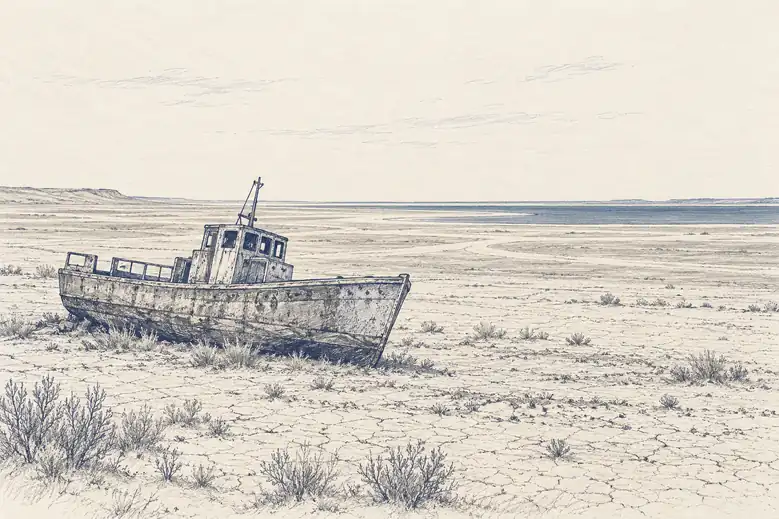
What the record then showed could be seen no other way. The Aral Sea, once roughly 68,000 square kilometres, the fourth-largest lake on Earth, was measured shrinking to under a tenth of that area as the rivers feeding it were diverted to irrigate cotton, not as a single before-and-after but as a continuous retreat, year by year. Brazil's forest loss was measured climbing through the 1990s to close to 28,000 square kilometres in a single year in the early 2000s, then falling sharply once enforcement took hold, a turn that was visible precisely because the measurements kept coming after the story seemed to have an ending. Nobody on the ground could have measured either at that scale. Nobody can go back and measure 1985 now. The only witness to 1985 is whatever was already recording in 1985.
SENTINEL AND COPERNICUS
Europe built a whole planet's worth of instruments and gave it away
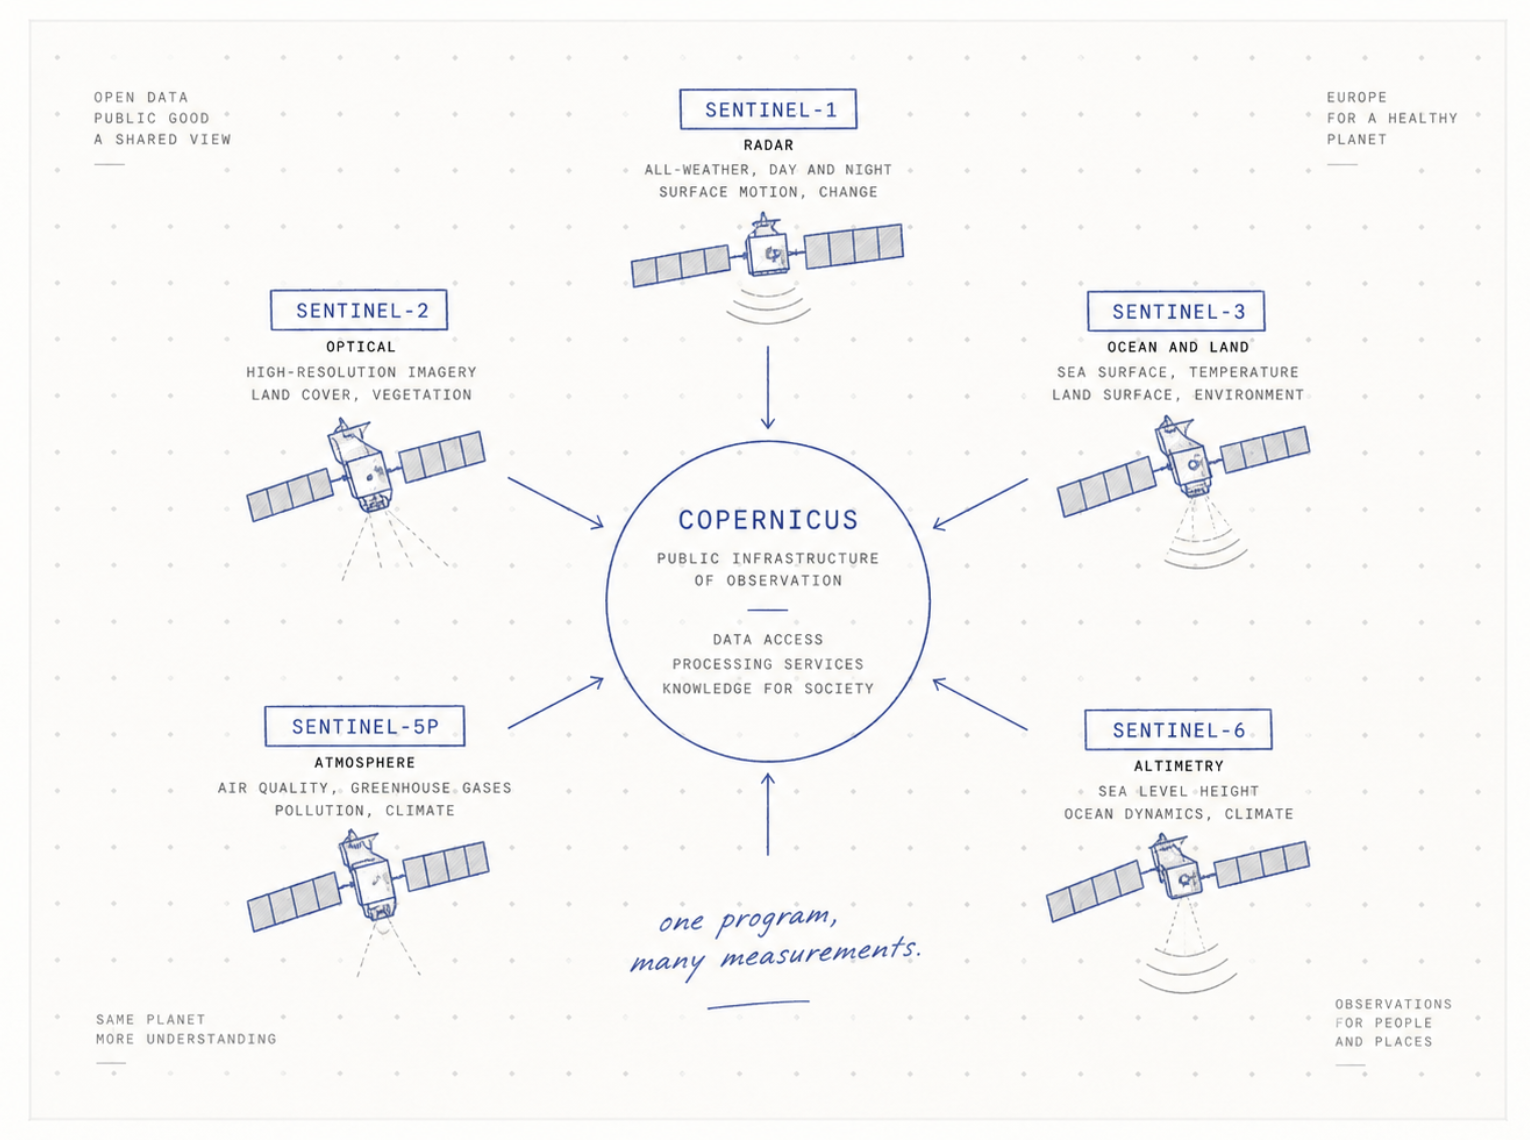
On 19 May 1998, in the Italian lakeside town of Baveno, the European Commission, Europe's space agencies and the weather-satellite agency EUMETSAT signed a proposal for a long-term European Earth monitoring program. It became Copernicus in 2012. Anyone could already use Landsat, so the question was not access. It was whether Europe wanted the future of its own environmental record to depend on another country's budget. It decided it did not, and it built a second record that anyone on Earth can use for anything, commercial uses included, at no cost.
Copernicus went further than Landsat in the other direction too, by watching more than land. Sentinel-1 brought the cloud-piercing radar that maps floods through storms. Sentinel-2 brought 10-metre detail every five days. Sentinel-3 reads ocean colour and the temperature of sea and land. Sentinel-5P carries TROPOMI, an instrument that maps nitrogen dioxide, methane, sulphur dioxide and ozone in enough detail to trace pollution to individual cities and power plants. Sentinel-6 continues the record of sea level. Land pictures, the part most people think of as Earth observation, turned out to be about a quarter of the job; the rest is air, water and ice.
Europe was not alone in deciding its own planet was worth watching. India's program grew from the physicist Vikram Sarabhai's argument that a developing country could not afford to skip space technology if it helped manage water and crops, and launched its first remote sensing satellite, IRS-1A, in 1988. Japan's ALOS carried optical cameras and a radar on one platform in 2006, because in a country of typhoons and landslides the clouds are usually part of the disaster. China's Gaofen series began in 2013 and passed dozens of satellites within a decade. Nobody designed a global observing system. Several nations, each for its own reasons, built pieces of one.
MODIS
MODIS made every day the normal interval
Landsat's 16 days were perfect for a shrinking sea and far too slow for a fire. The Moderate Resolution Imaging Spectroradiometer, MODIS, flying on NASA's Terra from 1999 and Aqua from 2002, took the opposite bargain. Each image is a swath 2,330 kilometres wide, more than twelve times Landsat's, with coarser pixels of 250 metres to a kilometre. Between the two satellites, nearly every place on Earth is seen twice a day.
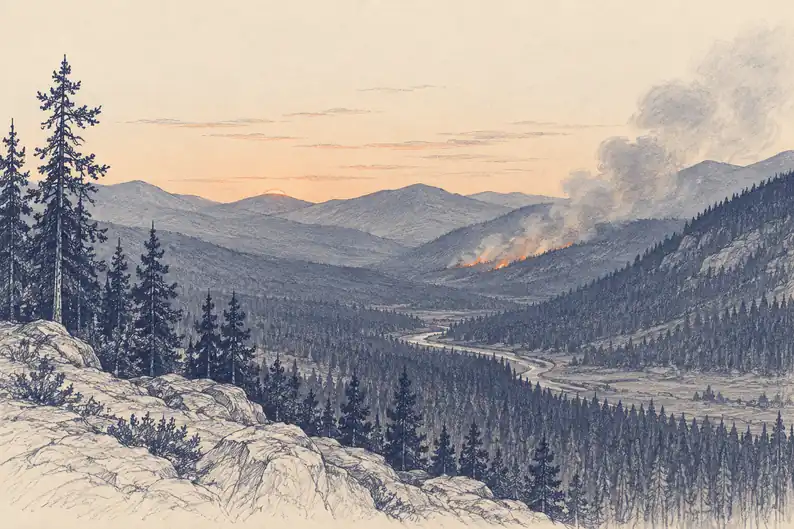
Fire showed what that meant. MODIS's thermal bands can detect a fire covering only a small fraction of one pixel, and NASA's processing turns each detection into a global fire map within hours. Before this, a fire in a remote forest could burn for days before anyone with the authority to respond had a clear picture of it. Now firefighters, farmers and researchers on every continent could see every sizeable fire on the planet, updated before the next sunrise. Dust storms crossing oceans, snow retreating across a mountain range, algae blooming in a lake: processes that unfold over days finally had an instrument fast enough to keep up.
Twenty years of daily data did something quieter as well. It moved the baseline of what counted as a reasonable wait. A satellite returning every 16 days, the gold standard for a generation, began to feel slow. Terra and Aqua are now decades past their planned lives, and NASA and NOAA built their successor, VIIRS, flying since 2011, before either failed, using shared methods so that the fire and snow records could cross from one instrument to the next without a break. Keeling's lesson had been learned at planetary scale: the record matters more than any one instrument that keeps it.
Terra
10:30 AM · descending
Aqua
1:30 PM · ascending
VIIRS
since 2011 · planned successor
Built before either satellite failed, not after.