COSMICS · CHAPTER 3.7
Trees, Water and Soil Became Time Series
A forest stopped being a place and became a curve: greenness, moisture and mass, sampled over decades.
EARTHVISION LAB · ~14 MIN READ
FROM PLACE TO PROCESS
Once a fixed grid is re-measured on a schedule, a forest stops being an object on a map and becomes a curve. Greenness rises in spring and falls in autumn. Soil moisture spikes after rain and decays at a rate that depends on what the soil is made of. An ice sheet loses mass in a line that bends.
This is the representational form that most of Earth science now runs on, and it changed the questions that could be asked. A curve has a slope, a seasonal shape, an anomaly relative to its own history. A snapshot has none of those.
FORESTS AND CROPS
Vegetation as an annual rhythm rather than a category
Plotted across a year, a vegetation index traces a curve with a start of season, a peak, and a senescence, and the shape differs by crop, by species, by management. That curve is how satellite data distinguishes maize from soy without ever resolving an individual plant: not by what the field looks like on one date, but by the rhythm it follows across many.
The same logic detects loss. Forest disturbance alerts built on Landsat and Sentinel imagery work by comparing a location's current reflectance against the pattern it has followed historically, and flagging departures. Confirmation usually requires the anomaly to persist across several subsequent images, because a single deviation is as likely to be cloud shadow as a chainsaw.
There is a deeper measurement underneath greenness that Volume 1 already touched: solar-induced fluorescence, a faint glow re-emitted by chlorophyll during photosynthesis. Greenness says a plant has leaves. Fluorescence says whether those leaves are currently working, which is a different variable that happens to look similar from orbit.
RIVERS, SOIL AND ICE
Water measured as level, as moisture, and as weight
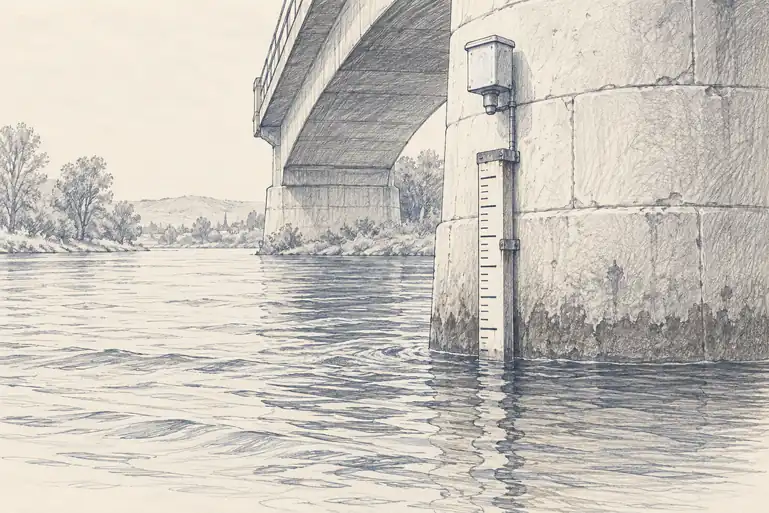
River gauges are among the oldest continuous environmental instruments still in operation, and they measure something deceptively narrow: the height of water at one cross-section. Discharge, the volume actually passing, has to be inferred from that height using a relationship specific to that channel, which shifts whenever the channel does. A gauge record is therefore a long series with a quietly moving definition inside it.
Soil moisture is harder, because it varies within a single field and cannot be seen directly from orbit. Missions like SMAP infer it from microwave emissions, which respond to water content in the top few centimeters. That depth limit matters: crops draw water from far deeper than a satellite can sense, so the measurement is a proxy for the thing that actually determines whether a plant is stressed.
The most unusual water measurement in this book weighs it. Volume 1 already described the basic trick behind GRACE: sensing gravity shift between paired spacecraft to catch mass disappearing. The representational point worth adding is that no single GRACE pass means anything at all. One measurement of gravity is just a number. It is only the difference between this month's pass and last month's, repeated for years, that becomes a mass-loss time series, which is why groundwater depletion beneath farmland became visible from orbit for the same structural reason a vegetation curve does: nothing showed up until the same grid was measured the same way, again and again.
SOIL CHEMISTRY
Ground truth still has to come from the ground
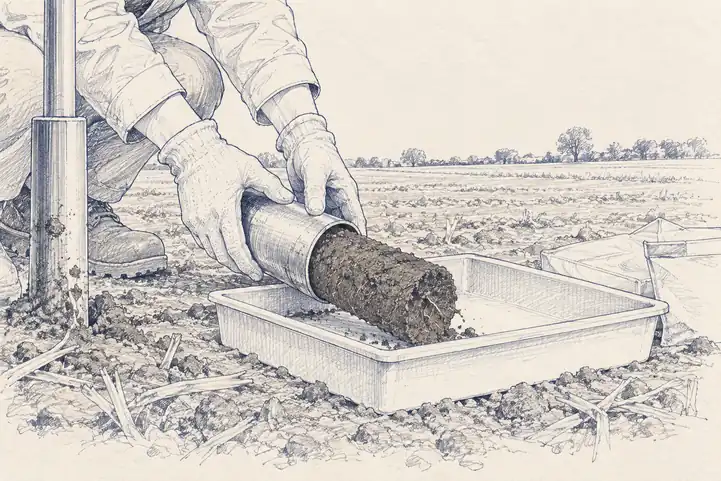
Soil chemistry resists remote measurement almost entirely. Nitrogen content, pH and organic carbon are properties of material below the surface, and no orbital sensor reads them directly. The only way to know is to dig, bag and assay, which is accurate and does not scale to a continent.
iSDAsoil, built by the nonprofit iSDA, works around that by training a model on more than 100,000 physically assayed samples, matched against Sentinel-2 and Landsat imagery, terrain and climate, and predicting soil properties everywhere in between. The output covers all of Africa at 30-meter resolution across more than 20 properties, replacing maps that had been roughly 250 meters.
It is worth being precise about what that product is. It is not a soil measurement. It is a model's estimate of what a soil measurement would find, anchored to real assays and extrapolated by correlation. That distinction is invisible in the map and central to how it should be used, and it is the exact place where this volume ends and Volume 4 begins.